Research School of Astronomy and Astrophysics
Fyris Alpha Simulation Code
|
Research School of Astronomy and Astrophysics
Fyris Alpha Simulation Code
|
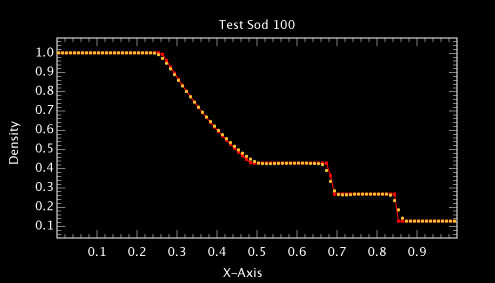
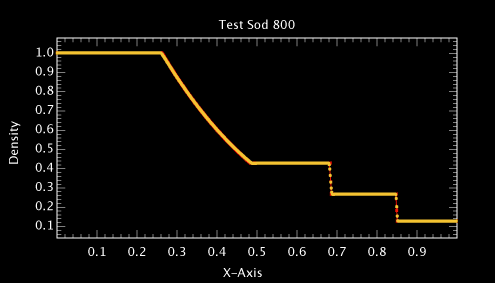
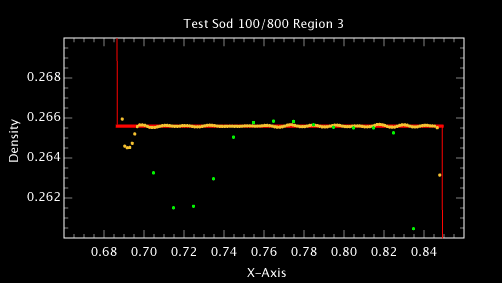
1D Convergence Test: Sod ShockThe 1D convergence tests consist of single Riemann problem with a known solution, the standard sod shock. The solution on 100, 200, 400 and 800 cell resolution. The L1 density norm over the whole grid and in 3 defined sub-regions are compared. The code and configuration files plus output for Fyris to run the 1D Riemann Sod Problem will be available soon. The Sod TestSpecified as follows:
Results
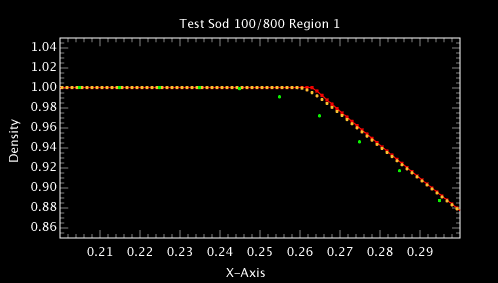
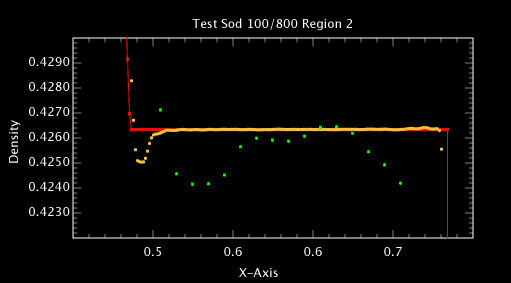
Four regions are defined for L1 norm analysis,
L1 Norm Errors, as percentages
Plots comparing the exact and computed models follow. Finite models are shown as yellow dots, exact solutions as red line and red square dots. Symbols used in the region plots, sod100 green, sod800 yellow, exact solution red line only.
|
|||||||||||||||||||||||||||||||||||||||||||||||||||||||||||||||||||||||||||||||||||||||||||||||||||||||||||||||
|
Page last updated: Wednesday, 03-Mar-2010 17:21:38 AEDT Please direct all enquiries to: Ralph.Sutherland@anu.edu.au Page authorised by: Ralph Sutherland |
|
The Australian National University CRICOS Provider Number 00120C — ABN: 522 34063906 |