Research School of Astronomy and Astrophysics
Fyris Alpha Simulation Code
|
Research School of Astronomy and Astrophysics
Fyris Alpha Simulation Code
|
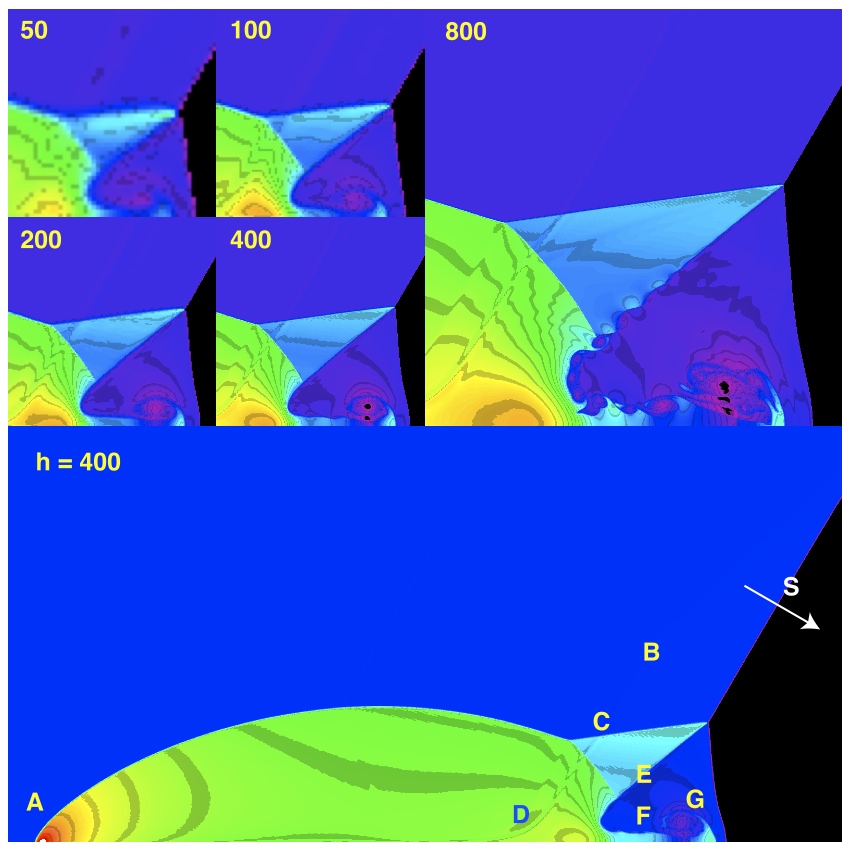
2D Double Mach Reflection Shock Wedge TestThis is an example of complex boundary conditions, and the emergence of a complex self-similar structure in the multiple shocks that form from a simple initial geometry. A horizontal Mach 10 shocked flow impinges on a ramp, or wedge, at an angle of 30 degrees up from the horizontal.In the simulation the shock is setup as an oblique shock, and the wedge is set as a partially reflecting horizontal lower boundary. The horizontal axis is 4.0 units long, and is a free outflow for the first $1/6$ units, then reflecting for the rest of the boundary. The upper boundary is updated with the time-dependent oblique shock location. The left and boundary is constant with the post oblique shock values, and the right boundary is free. The remaining problem parameters are:
As the shock moves, it impinges on the reflecting part of the lower boundary and a complex shock reflection structure forms. The simulation was run for a range of resolutions, from h = 50 to h = 800. The overall appearance, in the density variable, is shown in the lower panel of figure \ref{f:machwedge}. Key features include:
The upper panels show the leading structure as a function of increasing resolution, showing the essential features even at the lowest resolution, while the saturated Kelvin-Helmholtz instabilities occur in the slip layers, E -- F -- G, at sufficiently high resolutions.
|
|
Page last updated: Wednesday, 03-Mar-2010 17:21:19 AEDT Please direct all enquiries to: Ralph.Sutherland@anu.edu.au Page authorised by: Ralph Sutherland |
|
The Australian National University CRICOS Provider Number 00120C — ABN: 522 34063906 |