 |
Multiband photometry of stars in the Kepler field allows us to choose the most appropriate set of filters for each stellar parameters. One of the key advantages of our approach is that we use seismic information to improve the determination of photometric quantities. All parameters described in the following are derived iteratively, in a fully self-consistent manner.

The effective temperature is derived using the Infrared Flux Method (IRFM) with initial log(g) and E(B-V) from the Kepler Input Catalogue and an assumed [Fe/H] of -0.2, a value roughly representative of the Kepler field. This Teff is then fed into a asteroseismic Bayesian scheme to obtain the mass and the radius of each star, and in turn, an improved, seismic value of log(g). We continue to iterate between log(g) and Teff until reaching convergence.
In addition to Teff, the IRFM also provides an estimate of stellar angular diameter, θ. By scaling θ with the asteroseismic radius, we compute the stellar distance. Using empirically calibrated, three dimensional Galactic extinction models, this distance is then used to derive a new E(B-V) value, which is then used to deredden the uvby photometry and derive Strömgren metallicity, [Fe/H].
 |
The above series of steps defines one iteration, and the updated set of E(B-V), log(g), and [Fe/H] determined are then used as inputs to run the IRFM again. We continue to iterate until convergence is achieved for all parameters, typically three iterations.
We note that in addition to our Strömgren photometry, which is used exclusively for deriving [Fe/H], three broad-band systems are used in the IRFM. This implies three slightly different sets of Teff, Ƒbol, and θ. Therefore, three sets of seismic parameters, distances, reddening estimates, and thus [Fe/H], are obtained with a single reddening map. The differences between these sets are relatively small. Altogether we explore the use of three different broad-band photometric systems and three reddening maps for a total of 9 different sets of self-consistent parameters.

Effective temperatures are derived using the IRFM described in Casagrande et al. (2010). This technique uses multiband optical and infrared photometry to recover the bolometric and infrared flux of each star, from which its Teff and θ can be computed.
For SAGA, we implement the IRFM with three different optical systems (KIC griz, Johnson BV, and Sloan g'r'i') and use 2MASS photometry in the infrared. We stress here that optical broad-band photometry is preferable to Strömgren for the IRFM, since comparably little flux is encompassed within the intermediate band-width of the Strömgren system. Furthermore, Strömgren bands are designed to be sensitive to both log(g) and [Fe/H], which would make the IRFM estimates dependent upon these parameters.

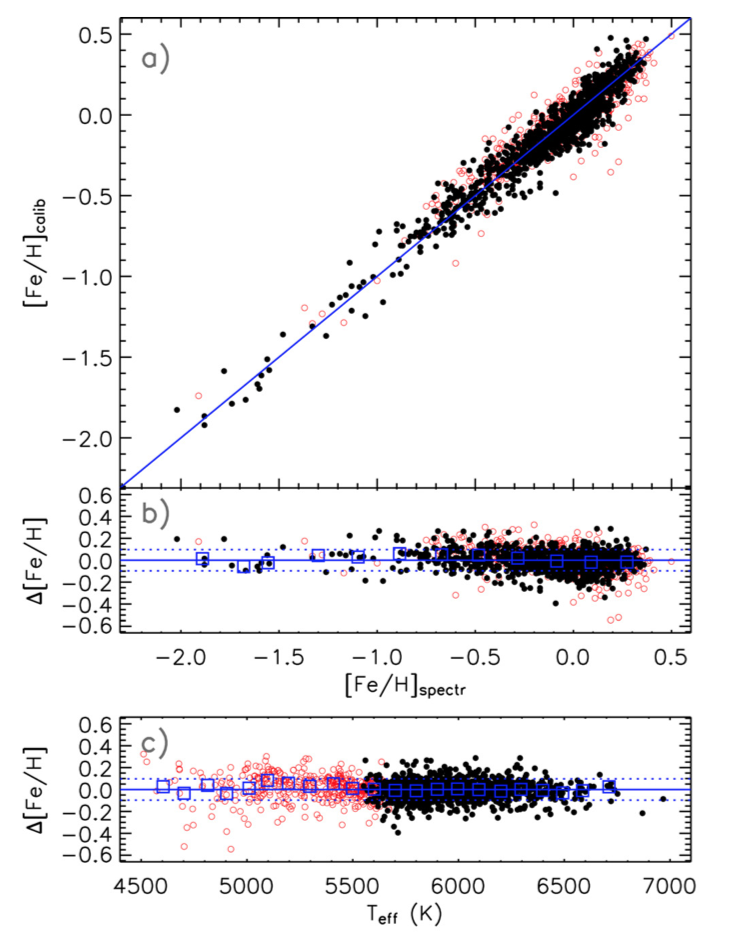
Using Strömgren photometry of dwarf and subgiant field stars (Casagrande et al. 2011), and monometallic globular clusters and field giants (Casagrande et al. 2014), we have derived metallicity calibrations for dwarfs and giants over a limited range of uvby color indices. Notice that we refer to m1, c1, and (b-y) with the implicit understanding that when using these calibrations these indices must first be dereddened
For hotter dwarfs (Teff ≿ 5600 K):
[Fe/H] = 3.927log(m1) - 14.459m13 - 5.394(b-y)log(m1) + 36.069(b-y)m13
+ 3.537c1log(m1) - 3.500m13c1 + 11.034(b-y) - 22.780(b-y)2 + 10.684c1
- 6.759c12 - 1.548
where:
0.23 ≤(b-y) ≤ 0.63
0.05 ≤ m1 ≤ 0.68
0.13 ≤ c1 ≤ 0.60
[Fe/H] ≿ -2.0
For cooler dwarfs (Teff ≾ 5600 K):
[Fe/H] = -0.116c1 - 1.624c12 + 8.955c1(b-y) + 42.008(b-y) - 99.596(b-y)2 + 64.245(b-y)3 + 8.928c1m1 + 17.275m1 - 48.106m12 + 45.802m13 - 8.467
where:
0.43 ≤(b-y) ≤ 0.63
0.07 ≤ m1 ≤ 0.68
0.16 ≤ c1 ≤ 0.49
[Fe/H] ≿ -2.0
Note that in the region of (b-y) color overlap, we average the metallicity from the two calibrations.
For giants:
[Fe/H] = -9.037(b-y) + 4.875c1 + 17.187m1 + 3.672(b-y)c1 - 9.430(b-y)m1
- 12.303c12 - 17.405m12 + 6.159(b-y)2 + 12.917m13 - 0.972
where
0.45 ≤(b-y) ≤ 1.10
0.08 ≤ m1 ≤ 0.92
0.08 ≤ c1 ≤ 0.59
-2.6 ≾ [Fe/H] ≾ 0.5
Note that
m1 = (v-b)-(b-y) and c1 = (u-v)-(v-b)
As the SAGA survey continues, we plan to improve and expand the calibration for giants with a larger and more uniform sample of stars with spectroscopic metallicities and abundances.
 |
|
|
nbsp

Even though the Galactic stripe observed for our initial SAGA release avoids excessively high values of color excess, non-negligible reddening is still present and must be corrected for before we can use photometry to derive stellar parameters. Because we derive distances for all our stars, we can use three-dimensional extinction models, namely those of Drimmel et al. (2003) and Amôres & Lépine (2005). We rescale thse models such that they have E(B-V) of 0.14 at the position and distance of NGC6819, an open cluster within our initial stripe.
We also use an empirical method to estimate E(B-V), examining the variation in color overdensities in the 2MASS point source catalog with respect to Galactic latitude. The two different reddening maps and our empirical method show good overall agreement and implies that our stellar parameters are not severely affected by reddening.

Stellar oscillations driven by surface convection create a pattern in time series photometry. We have analyzed Kepler long-cadence data through Quarter 15 for all giants in our inital SAGA sample to measure the average separation between peaks of the same spherical angular degree and consecutive radial order, Δν, and the frequency of maximum amplitude νmax. These values allow us to estimate properties of the individual star, as they reflect the structure of the stellar interior. To a good approximation, Δν scales with the mean density of the star, while νmax is related to the surface properties. Using scaling relations, these global oscillation frequencies are related to the mass, radius and effective temperature of a star. For a large fraction of stars the period spacing between mixed dipole modes was also measured to provide unambiguous classification between stars climbing the red giant branch and those already on the red clump.
Examining the oscillation pattern allows us to estimate the properties of the individual star. We have used grids of isochrones in combination with a Bayesian analysis that intertwines classical (Teff, [Fe/H]) and asteroseismic (Δν, νmax) quantities to determine the stellar parameters of the SAGA sample. The effective selection function of pulsating stars observed by Kepler is not known. Therefore we cannot characterize a prior probability of stellar properties due to the star being in the Kepler sample. Thus, we assume a flat prior in [Fe/H] and age, with a cutoff at 16 Gyr. For the prior in mass, we assume a standard Salpeter initial mass function. Where we have mixed mode information, we also include information about the star's evolutionary phase in the prior.
Combining our computed prior and likelihood, we can calculate the probability distribution function for relevant stellar parameters, including mass and radius. From these values, we can estimate the surface gravity, log(g). Additionally, with an estimate of radius and θ, we can calculate precise distances. As with Teff and [Fe/H], mass, radius, and distance are determined via an iterative process (Silva Aguirre et al. 2011, 2012).

Stellar parameters have been derived self-consistently for 9 different combinations of photometric systems and reddening maps. We merge the results obtained from different photometric systems, while the use of different reddening maps enables us to estimate the size of systematic uncertainties stemming from interstellar extinction. For the catalogue published here we adopt the reddening map of Amôres & Lépine (2005).
For an in depth discussion of our error calculations, please see Casagrande et al. (2014). Here we list the median uncertainties in the SAGA sample.
| Parameter | Uncertainty |
| uvby | 0.03 mag |
| Teff | 82 K |
| [Fe/H] | 0.17 dex |
| θ | 2.0% |
| Ƒbol | 5.0% |
| E(B-V) | ±0.02 (assumed) |
| log(g) | 0.006 dex |
| Radius | 2.4% |
| Distance | 3.3% |
| Mass | 6.0% |
nbsp


