This is a small research project suitable for undergraduate Astronomy and Physics students.
It was put together by Helmut Jerjen from the Research
School of Astronomy and Astrophysics (ANU). Please send me an
e-mail if you are planning to do this project. I would be delighted to hear more about your own
results. Enjoy and have fun!
INTRODUCTION
SUNSPOTS: The surface of the Sun, called the photosphere, is at a temperature of 5800 degrees Kelvin.
Sunspots are cooler features (3800 degrees Kelvin) wandering across the disk of the Sun that
have been observed since ancient times.

When viewed through special telescopes (*never look
into the sun with the naked eye, binoculars or normal telescopes!*), they have a dark
central region known as the umbra, surrounded by a somewhat lighter region called the penumbra.

Sunspots are the site of strong magnetic fields. They typically grow over a few days and last anywhere from
a few days to a few months. They can be very large, as much as 50,000 km in diameter.
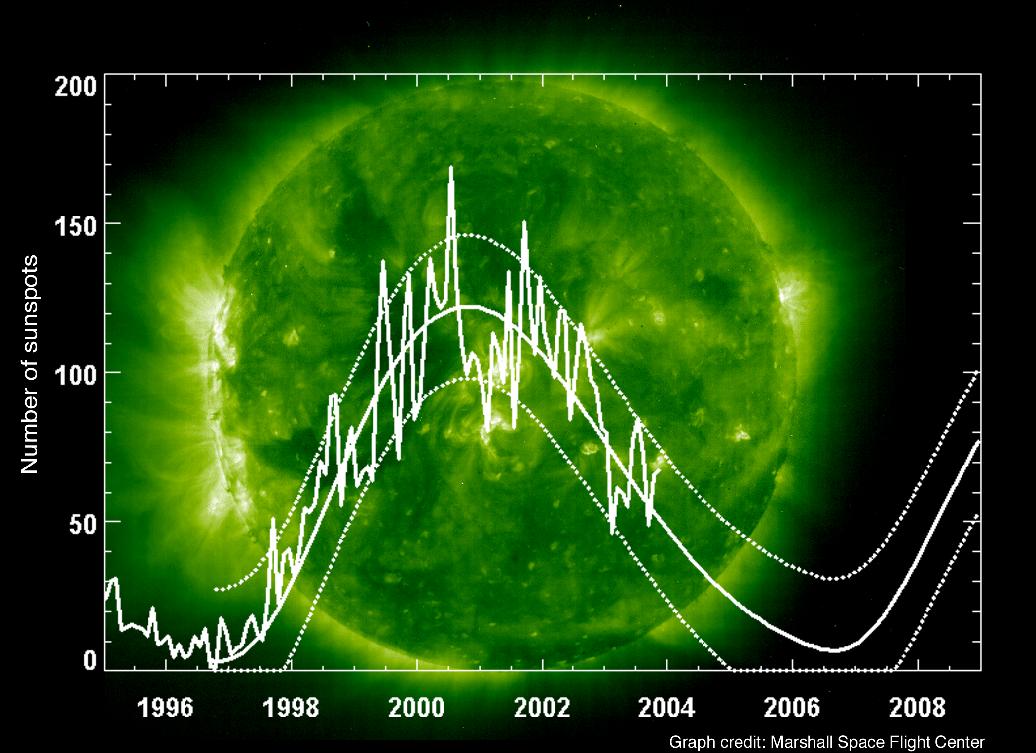
The number of sunspots you can count on the Sun's surface is not always the same, but varies over time.
Solar activity is directly related to the frequency of sunspots. Here is a plot showing the
number of sun spots since 1995:
ROTATION: The sun does not rotate as a rigid body. It is a gas from its outermost layers
down to its centre. The equatorial region of the photosphere rotates faster than do
regions at higher and lower latitudes. This is called differential rotation. The
differential rotation of the Sun's latitudes causes its magnetic field lines to
become twisted together over time, causing magnetic field loops to erupt from the
Sun's surface and trigger the formation of the Sun's dramatic sunspots and solar prominences.
SOHO: To follow the Sun's activities closely, the ESA/NASA solar observatory
SOHO was
launched into an orbit around the Sun, rather than an orbit around the Earth on December
1995. This assures that SOHO would provide solar data 24 hours a day. At no time would
the Sun be hidden from SOHO by the Earth. SOHO's position is around a point called the
L1 Lagrangian point, a rather stable location at which the gravitational pull from Earth
equals the gravitational pull from the Sun. L1 lies on the direct line between the Earth
and the Sun, approximately 1% the distance from the Earth to the Sun. This allows SOHO
to travel with the Earth as it revolves around the Sun, but at a distance of 1,500,000 km
closer to the Sun. SOHO is tracked and data is collected by the Deep Space Network (DSN),
a series of three deep space communications facilities strategically placed on three
continents, approximately 120 degrees apart around the world: Goldstone, CA (USA), Madrid
(Spain), and Canberra (Australia).
TOOLS
Image Analysis Software for your computer: ImageJ
(from the National Institutes of Health, USA) is freely available
for MaxOSX, Windows, and Linux x86.
Plotting Software such as MS Excel, IgorPro, or any of the
free plotting software.
Julian Date converter software for Windows
,
MacOSX. Web calculator can be found here .
PROJECT
Go to the Australian Space Weather Agency to learn more about
the observed monthly sunspot numbers. Do sunspots appear and disappear randomly or are there any patterns observable
over the years, decades, centuries? How many sunspots have been observed in May 2003? In which month were the
largest number of sunspots detected from 1995 to 2007?
Look at the SOHO Michelson Doppler Imager data
from a "good" year when the sunspots number frequency was particularly high.
Browse through the images and search for one that shows a big,
well-defined sunspot.
Save this image on your computer and open it with the Image Analysis Software ImageJ.
ImageJ allows you to find the x and y coordinates of the sunspot or any other feature on the sun.
Just move the cursor over the image and see how the coordinates change. What are the coordinates of
your sunspot? You may want to use the "zoom" to increase the acuracy of
your answer. Also determine the coordinates of the center and the pixel diameter of the sun? When
you compare that number with the sun's real diameter of 1 380 000 km, how big is one pixel in reality? How
many pixels in size would the Earth be on such an image?
The next task is to download a complete time series of images that illustrate how your sunspot
is moving due to the sun's rotation. For that purpose, search carefully for all images that show your sunspot
from appearing on the left edge of the disk, moving across, to disappearing on the right edge of the disk.
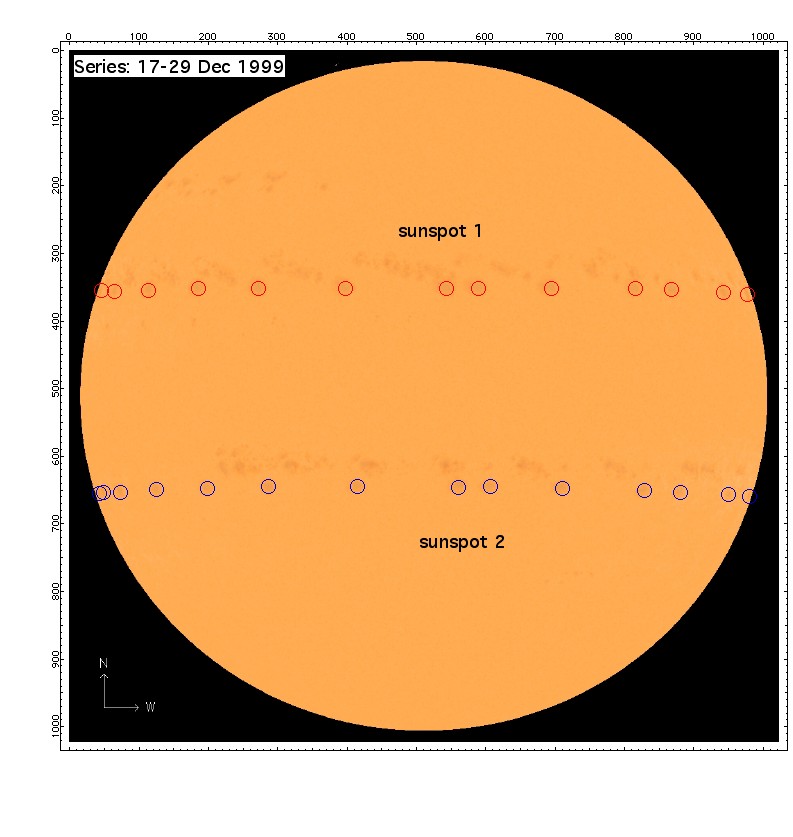
If you have difficulties to find a suitable sunspot you may want
to use either sunspot1 at x=542, y=350 or sunspot2 at x=560, y=644 on the image MDI_int_1999.12.23_14_00.gif.
Now we are going to analyse all images of the time series. Load the
image with the earliest date into ImageJ and measure the x and y coordinates of your sunspot.
Write these numbers into a spreadsheet of your plotting program. Also record the Julian date of
the image by converting the date as given in the image name into the Julian date. A Julian date converter
can be found here.
For example, the three numbers for sunspot1 on image MDI_int_1999.12.23_14_00.gif are:
2451536.08333, 542, 350. Repeat this procedure for all the other images in the time series.
Once this is done you can plot your results. The composite image on the left shows the sunspots'
motion and if you plot for instance the date and x-coordinate value from each image you can get a
graph like the one on the right:

What does the slope of the curve tell you?
The time has come to work out the differential rotation of the sun.
Let's go back to the time series. By comparing the dates of the first and last image (see image names)
you can get a rought estimate of the rotational period. What do you get? Did you take into account
that you observed only have of the rotation? The value that you got is the
rotation period for the latitude of the sunspot. Let's work out the
latitute of your sunspot. To do this you need the trigonometric equation:

Can you work this equation out yourself? The latitudes of sunspot1 and
sunspot2 are: 18.7 and -16.3 degrees. Now, we need many more of these
observations. Go back to
the SOHO Michelson Doppler Imager data
and find more sunspots that occur at various solar latitudes. Find for
each sunspot the "first" and "last" image, estimate the rotational period and calculate the
solar latitude.
.......................
Browse through the images and search carefully for one sunspot that last for several months (very tricky).
Find sunspots that cover a range in solar latitude (close to and away from the solar equator).
Once you have found a set of (5-10) suitable sunspots use a graphic program to measure and record
accurate x (longitude) and y (latitude) coordinates of the selected sunspots on every image
(2-4 images per day) over as many days as possible as long as they are visible (note: the zero point
of the coordinate system can be chosen arbitrarily.)
Plot the x and y coordinates of each sunspot as a function of time (time series). The apparent motion of a sunspot
across the Sun's disk at constant velocity follows a sine function: slower motion when appearing and disappearing and
faster motion when crossing the center of the disk. Use a Mathematical program to fit a sine function at the observed
data. The result could look like this.
Note the gaps in the time series due to the sunspots being unaccessible while travelling on the backside of the sun.
Determine the rotation periods for all sunspots. Do you have to apply a correction for the motion of the SOHO
satellite around the Sun? Compare the results with their latitude coordinate to find evidence for differential
rotation. The plot could look like
this .
Discuss your results within the context of other people's findings reported on the internet and on
ADS by the
professional astronomers
(e.g. Tang 1980 or
Newton & Nunn 1951)
What are effects not taken into account in our experiment (2nd and 3rd order effects) and how could the experiment be improved?
LINKS
History of Solar Physics
Images credits: Courtesy of SOHO consortium. SOHO is a project of international cooperation between ESA and NASA.
Comments and feedback: jerjen@mso.anu.edu.au
Last update: October, 2007

