This is a small research project suitable for undergraduate Astronomy and Physics students.
It was put together by Dr Helmut Jerjen
from the Research School of Astronomy and Astrophysics (ANU). Please send me an
e-mail if you are planning to do this
project. I would be delighted to hear more about your own
results. Enjoy and have fun!
ROTATION CURVE: When studying spiral galaxies it is invariably found that the stellar rotational
velocity in the disk remains constant, or "flat", with increasing distance away from the galactic
center. This result is highly counterintuitive since, based on Newton's law of gravity, the rotational
velocity would steadily decrease for stars further away from the galactic center. Analogously, inner
planets within the Solar System travel more quickly about the Sun than do the outer planets (e.g.
the Earth travels around the sun at about 100,000 km/hr while Saturn, which is further out, travels
at only one third this speed). One way to speed up the outer planets would be to add more mass to
the solar system, between the planets. By the same argument the flat galactic rotation curves seem
to suggest that each galaxy is surrounded by significant amounts of dark matter. It has been
postulated, and generally accepted, that the dark matter would have to be located in a massive,
roughly spherical halo enshrouding each galaxy.
DARK MATTER: it is a kind of matter that does not produce detectable amounts of light
but it does have a noticeable gravitational effect. Astronomers are not sure
what the dark matter is made of. Possibilities range from large things like
planets, brown dwarfs, white dwarfs, black holes to huge numbers of small things
like WIMPS, neutrinos or other particles that have not been seen in our laboratories yet.
To understand the nature of dark matter is one of the central research activities in astronomy today.
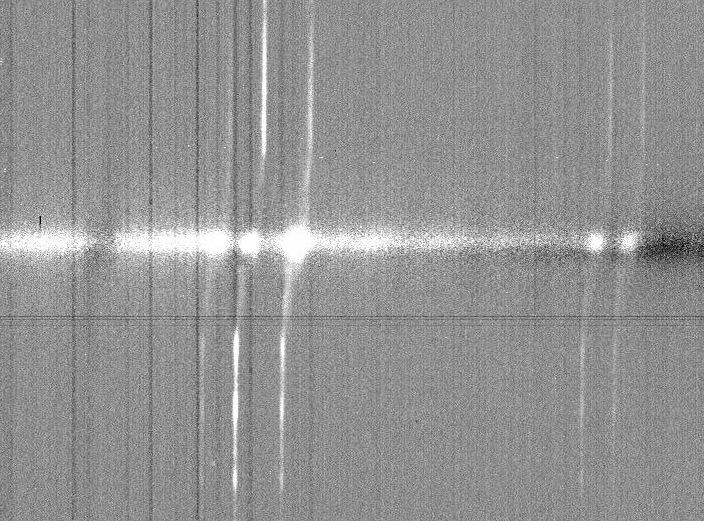
The rotation speed of the stars in galaxies is found NOT to decrease with increasing distance
from the galactic center (see emission lines in the spectrum), implying that the overall
mass distribution of the galaxy is different from the light distribution. The mass must continue to
increase: since the rotation speed satisfies v^2=GM/r, where M is the mass within radius r, we
infer that M increases proportionally to r.
MATERIAL: astronomical data visualization software like ds9 or
ImageJ , and the
galaxy spectra
METHOD
Your colleague from the European Southern Observatory sent you a set of spectra for the galaxy NGC6810 obtained at
the 3.5m New Technology Telescope. The 2-D CCD spectra can be downloaded
here .
The slit of the spectrograph was centred on the galaxy and aligned parallel to its major axis. On the
CCD each row corresponds to a spectrum of the target galaxy at a specific location along the major axis.
NGC6810_[1-4].fits:
You will notice five prominent S-shaped emission lines when you display one of the spectra. Your first task is to
analyse one of the spectral lines to derive the rotation curve of the galaxy. The first group of three emission
lines are (from left to right): [NII] @ 6548 A, H_alpha @ 6563 A, and [NII] @ 6584 A. The two emission lines on the
right are [SII] @ 6712 A and 6731 A. Please note that the quoted wavelengths are rest
frame wavelengths. From these numbers work out the spectral resolution of the spectrum (along the x-axis).
Consider the 2-D spectrum to be a landscape image. Every pixel has a position (x-y coordinates) and a height
(ie. the amount of flux in pixel x, y). Display the spectrum with ImageJ and select a bright emission line.
For each row in the spectrum (y-value) determine the x-value where the height (z) of the selected emission
line reaches its maximum. Record all the x, y, z information in a file, for instance in EXCEL.
After you obtained all the technical information you need to convert the values into physical quantities
by using the spectrograph pixel scale along the y-axis of 0.166 arcsec/pix on the sky and
the spectral resolution that you worked out before.
By analysing a NeAr-lamp spectrum, your colleague calibrated the galaxy spectrum and found
that the rest frame x-coordinate of the H_alpha line in the spextrum is at pixel 1686.3 ([NII]
@ 6584A is at 1702.5). Calculate the redshift of the galaxy, generate the apparent and true (inclination corrected)
rotation curve of the galaxy. Use the HST image of NGC6810 (NGC6810_WFPC2_606.fits)
here
to estimate the inclination. What is the maximum rotation velocity and the total amount of mass (including dark matter)
in the galaxy as a function of radius.
RESULTS: compare your findings with the results reported in the
literature.
Images and data credits: the galaxy spectrum and the data for the rotation curve were kindly made
available by Erwin de Blok.
Comments and feedback: jerjen@mso.anu.edu.au
Last update: May, 2009