 More
More
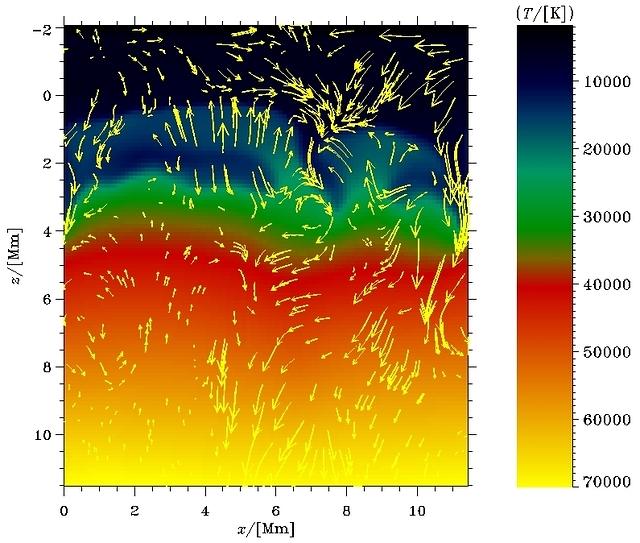
Vertical cross-section of an A9 main sequence star
This is a vertical cross-section through a snapshot of a simulation of an A9 main sequence star.
The colour scale shows the temperature structure and the arrows show the velocity-field. The longest arrows correspond to the highest velocities of about 29 km/s. The up-flow enters from the bottom of the simulation, bringing up hot plasma from the interior. This up-flow is stopped abruptly at the surface, which is seen as a sharp drop in temperature, where the up-flow is diverted sideways to the inter-granular lanes, cooling down on the way, and finally entering the cooler and faster down-drafts. This represents the cycle of convective transport of energy from the interior to the surface of a star. The cool pocket of plasma in the left side, at a depth of 2 Mm, has a diverging flow and it is still not fully understood.
© Regner Trampedach, Robert F. Stein and & Aringke Nordlund.
 More
More